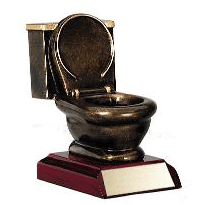
One league record fell this year, and another was tied! Plus there were several new additions to the leaderboard. Check out all the single-season team records here.
Here's an in-depth look:
New League Records
Pythagoras believed that the best way to determine a team's true level of ability is not won-lost record, but rather the number of runs scored and runs allowed. By this standard, Livingston Last Place may be the worst team of all time. They scored 600 runs and allowed 982 runs for a -382 run differential -- good enough, or rather bad enough, to set a new league record. The previous record of -323 was set in 2007 by the Las Vegas Rat Pack. (Interestingly, the 2008 Rat Pack won 106 games, so maybe there's hope for Livingston after all.) Note that team runs scored/runs allowed data is not available before the 1997 season, so it's quite likely that the 1993 Waikiki Keys, who went 33-129, or even the 1993 Charleston Chiefs, who went 46-116, may have had even worse run differentials. But those stats are lost to history, so the league record now belongs to Livingston.
The Amityville Ant Slayers tied the league record for the best fielding percentage at .990. The Ant Slayers tied the record set in 2002 by the Wanaque Wolverines. Two other teams, the Newark Sugar Bears and Matthew's Mighty Men of Marietta, joined a log jam of 10 teams tied for the 5th-best fielding percentage of all time at .988.
New DMB Era Records
The worst road record was set by Livingston Last Place, who went 17-64 (.210), setting a new DMB Era (1997-present) record! The previous modern record was set in 2006 by D.C. Bushslappers, who went 19-62 in 2006. The all-time record is still held by the Waikiki Keys, who won just 15 road games (.188 W%) in 1993.
New In The Top 5
The 600 runs scored by Livingston Last Place was the second-fewest runs scored in league history, behind only the 572 runs scored by the Hawaii Volcanoes in 1999. The previous second place mark was held by the 2003 Columbia Rattlesnakes, who scored 617 runs.
The 623 runs allowed by the Newark Sugar Bears was the third fewest of all time, just eclipsing last year's Vancouver Iron Fist, who allowed 624 runs. The all-time record is 587 runs allowed by the Iron Fist in 1998.
The 47-115 performance by Livingston Last Place tied with the 1999 Norfolk Ewes for the fourth-worst record in league history. The worst record in history was set by the 1993 Waikiki Keys, at 33-129; the modern record was the 44-118 record of the Phoenix Dragons in 1997.
Joining the leaderboard in best team quality start percentage were the Newark Sugar Bears, with a .617 QS% for fourth-best all-time. The Hopatcong Floating Fish had a .605 QS%, which ranks 6th all-time, just behind the 2004 Carolina Mudcats (.611).
The Bridgewater Mallers led the league in pitchers' strikeouts with 1,467, good enough for 5th all-time. Bridgewater knocked the 2009 Las Vegas Rat Pack and their 1,448 Ks out of the top 5. The 2008 Rat Pack still hold the all-time record with 1,549 Ks.
Records That Didn't Fall
Matthew's Mighty Men of Marietta's league-best 107-55 record didn't make the leaderboard; it tied the 1994 Vancouver Iron Fist for the 13th best record of all time. The 2002 Arkansas Golden Falcons still have the best all-time record at 120-42.
The longest winning streak of the year was 10 straight wins, posted by Matthew's Mighty Men of Marietta, but it didn't crack the top 5. The 2006 Newark Sugar Bears and 2011 Las Vegas Rat Pack each won 13 straight games to tie for 4th place. The longest streak of all time is 17 games set by the 2009 Sugar Bears.
The Arkansas Golden Falcons lost 10 straight games, and Livingston Last Place ended the season with 10 straight losses. It would take 13 straight losses to reach the leaderboard, set in 1998 by the Columbia Crusaders and tied in 2006 by the Honolulu Sharks. The all-time record was set in 1999 by the Crusaders.
The best home record this year was set by Matthew's Mighty Men of Marietta at 57-24 (.704). A team would have to win 62 games at home to reach the leaderboard by tying the Newark Sugar Bears' home record in 2006; the all-time record of 65 home wins was set in 2008 by those same Sugar Bears.
This year's worst home record of 30-51 (.370) was set by Livingston Last Place. To crack the top five a team would have to win just 25 games at home to crack the top 5; the worst home record of all time was set in 1993 by the Waikiki Keys, who won just 18 games at home. The modern record was set in 1997 by the Phoenix Dragons, who went 22-59 at home.
Matthew's Mighty Men of Marietta had the league's best road record this year at 50-31 (.617). To break into the top 5, a team would have to win at least 55 games to tie the 5th-best record, set in three different seasons by the Newark Sugar Bears. The all-time best road record was set in 1997 by the Vancouver Iron Fist, who went 60-21.
The most runs scored this year was 883 by Rowdy Roddy's Pipers. A team would have to score 1,123 runs to tie the 1997 Arkansas Golden Falcons for 5th place; the all-time record belongs to the Newark Sugar Bears, who scored 1,383 runs in 2007.
The most runs allowed was by Livingston Last Place, who gave up a whopping 982 runs -- more than a hundred runs more than the next worst team. But that wasn't good enough for even 5th place all-time, currently held by the 2001 Honolulu Sharks (1,021 runs allowed). The all-time record is 1,111 rusn allowed by the Phoenix Dragons in 2000.
The best run differential was set by Matthew's Mighty Men of Marietta, with a +171 run margin. Fifth place is currently held by the Arkansas Golden Falcons, who posted a +332 run differential in 2002; the record of +549 runs was set by the 2007 Newark Sugar Bears.
The most home runs hit this year were by the Hoboken Cutters with 231. To reach the top 5, a team would have to hit 288, set by the Jerusalem Rabbis in 1996. The all-time record is 330 by the Newark Sugar Bears in 2007.
The Sardine City Straphangers led the league this year with 101 stolen bases. To make the leaderboard, a team would have to steal 192 bases; the record was set in 1998 by the Phoenix Dragons with 228.
Hopatcong Floating Fish led the league with 353 doubles, but that's a long way from the 393 doubles hit by the Louisiana Lightning in 1997 for 5th place, or the league record 426 doubles hit by the Newark Sugar Bears in 2008.
The 47 triples hit by Sardine City Straphangers led the league, but it would take 57 triples to tie the Toledo Mutthens (1997) for 5th most all time. The record of 80 triples in a season was set by Cheyenne Warhawks in 1993 (thanks to Deion Sanders and his 62 triples that year).
The highest OPS this year was set by Rowdy Roddy's Pipers at .804; it would take a .902 OPS to reach the top 5, and a .995 OPS to set the all-time record, set by the Newark Sugar Bears in 2007.
Rowdy Roddy's Pipers also led the league with 851 RBIs, but it would take 1,121 to reach the leaderboard by tying the 1994 Arkansas Golden Falcons. The all-time record of 1,335 RBIs was set by the Newark Sugar Bears in 2007.
The lowest team ERA was set by the Newark Sugar Bears at 3.54; fifth-place still belongs to the Vancouver Iron Fist at 3.32. The all-time record is 3.08 set by the Arkansas Golden Falcons in 1992, and the DMB Era record is 3.10 set last year by the Philadelphia Endzone Animals.
Hopatcong Floating Fish just missed making the leaderboard with a 1.22 WHIP; to make the leaderboard, they needed a 1.21. The all-time record is 1.16, set last year by the Philadelphia Endzone Animals.
Another near-miss: the Vancouver Iron Fist had a league-best .685 OPS. A .684 OPS would have tied for 5th place and put them on the leaderboard. The lowest OPS allowed of all time (.653) was set in 2011 by the Philadelphia Endzone Animals.
Sardine City Straphangers posted a league-best .780 save percentage, which almost cracked the top 5. The Hillsborough Hired Hitmen in 2011 and the Honolulu Sharks in 2004 tied for a .784 SV%, tied for 4th place. The all-time record of an .836 SV% was set by the Straphangers in 2010.
This year's worst fielding percentage of .981, turned in by Livingston Last Place, was nowhere near the leaderboard. Six teams are tied at .975 for fourth-worst; the worst fielding percentage of all time, .973, was set by the Phoenix Dragons in 1998 and tied by those same Dragons in 2003.
Subscribe to:
Post Comments
(
Atom
)


2 comments :
good stuff!
I had the 2nd highest run differential in the league this year and didn't make the playoffs. Pythagoras fucked me in the ass!
Post a Comment